Data Insights
Deeply investigate your data, create charts, and take actions
Data Insights allows multi-dimensional analysis across apps, channels, and data sources providing on-demand data visualization and data export.
- Metric : The underlying data you want to look into
- Visualized: The type of chart or output
- Group By: The Data breakdown(s) you want your metric broken into. You can choose up to 2 with most charts, and an unlimited amount for Data Tables
Building a Data Query
- Begin by selecting the App, App Group, or data source you wish to pull data from using the drop down menu located at the top right of the window.
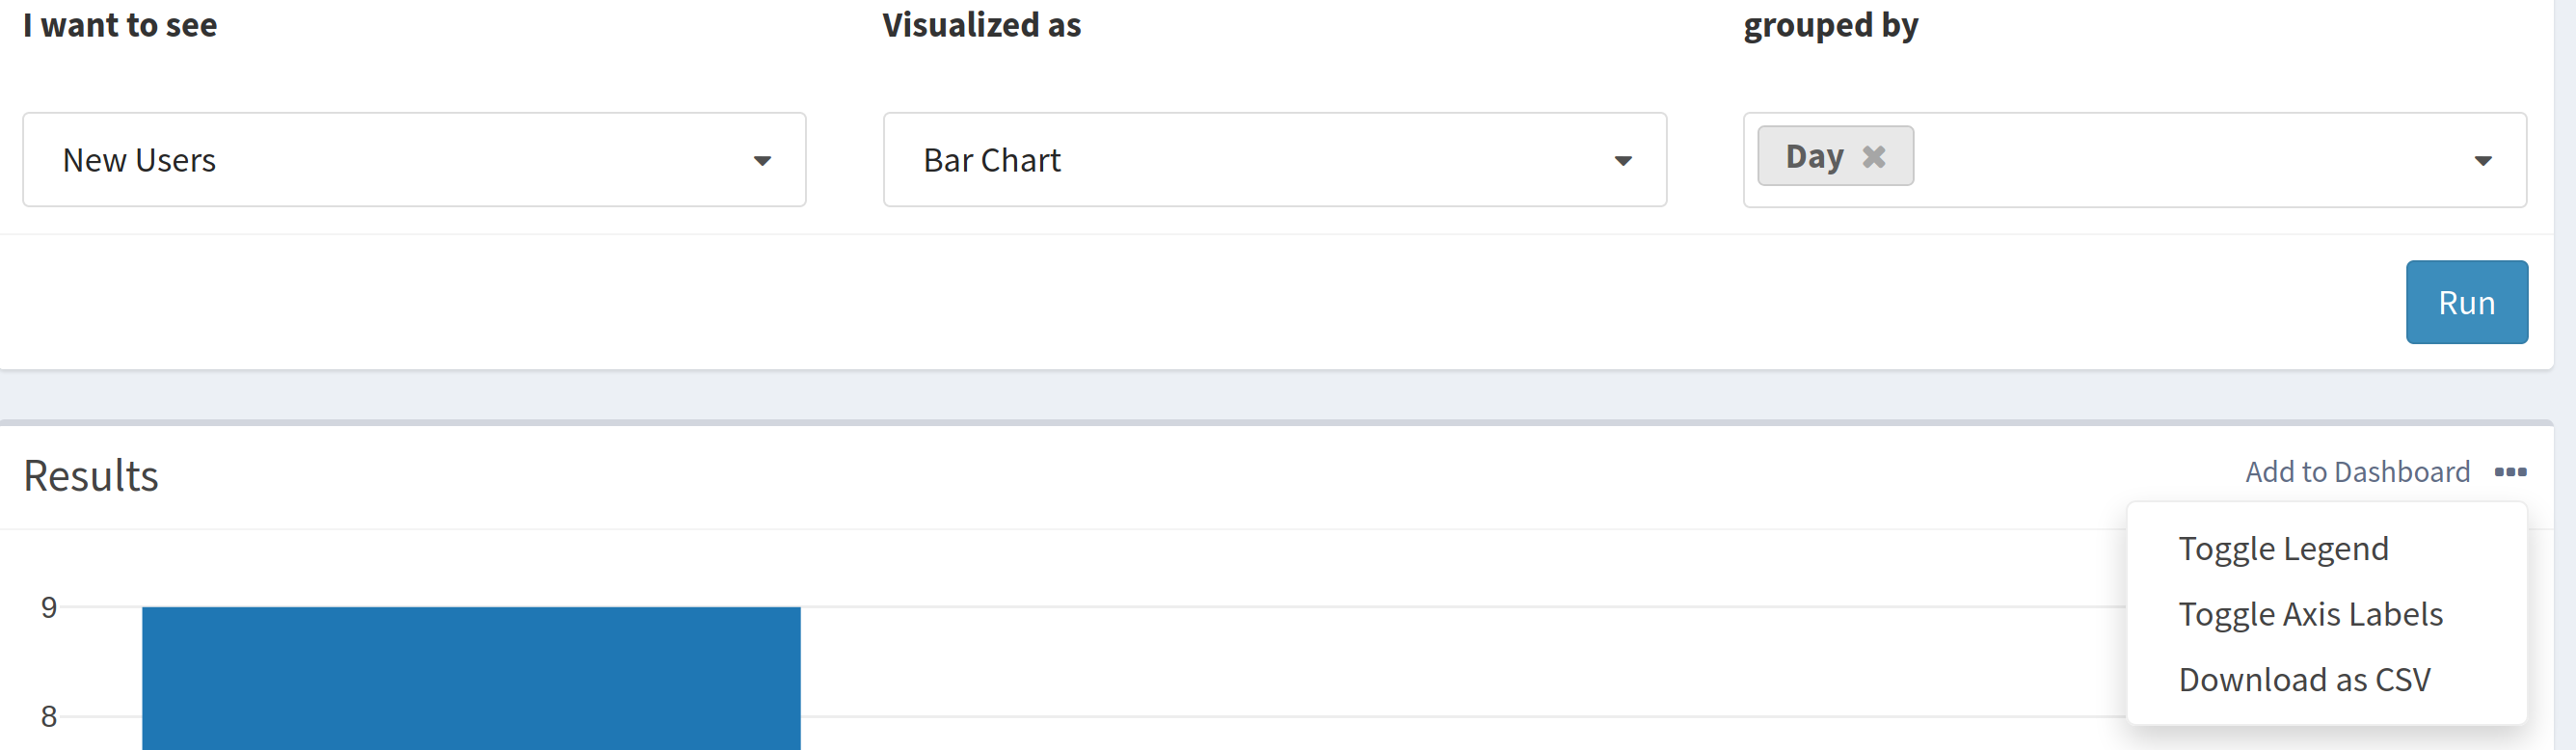
- Under I want to see, select your Data Metric using the drop down menu.
- Proceed to grouped by and select your Data Breakdown(s).
- You may choose to add a Filter by clicking Add Filter+.
- Finish by clicking Run button
Once your chart is displayed, you can Add it to a Dashboard, Download it as a csv, or make it full screen.
Last modified 0001-01-01