Dashboards
Rich User and Role based Dashboards
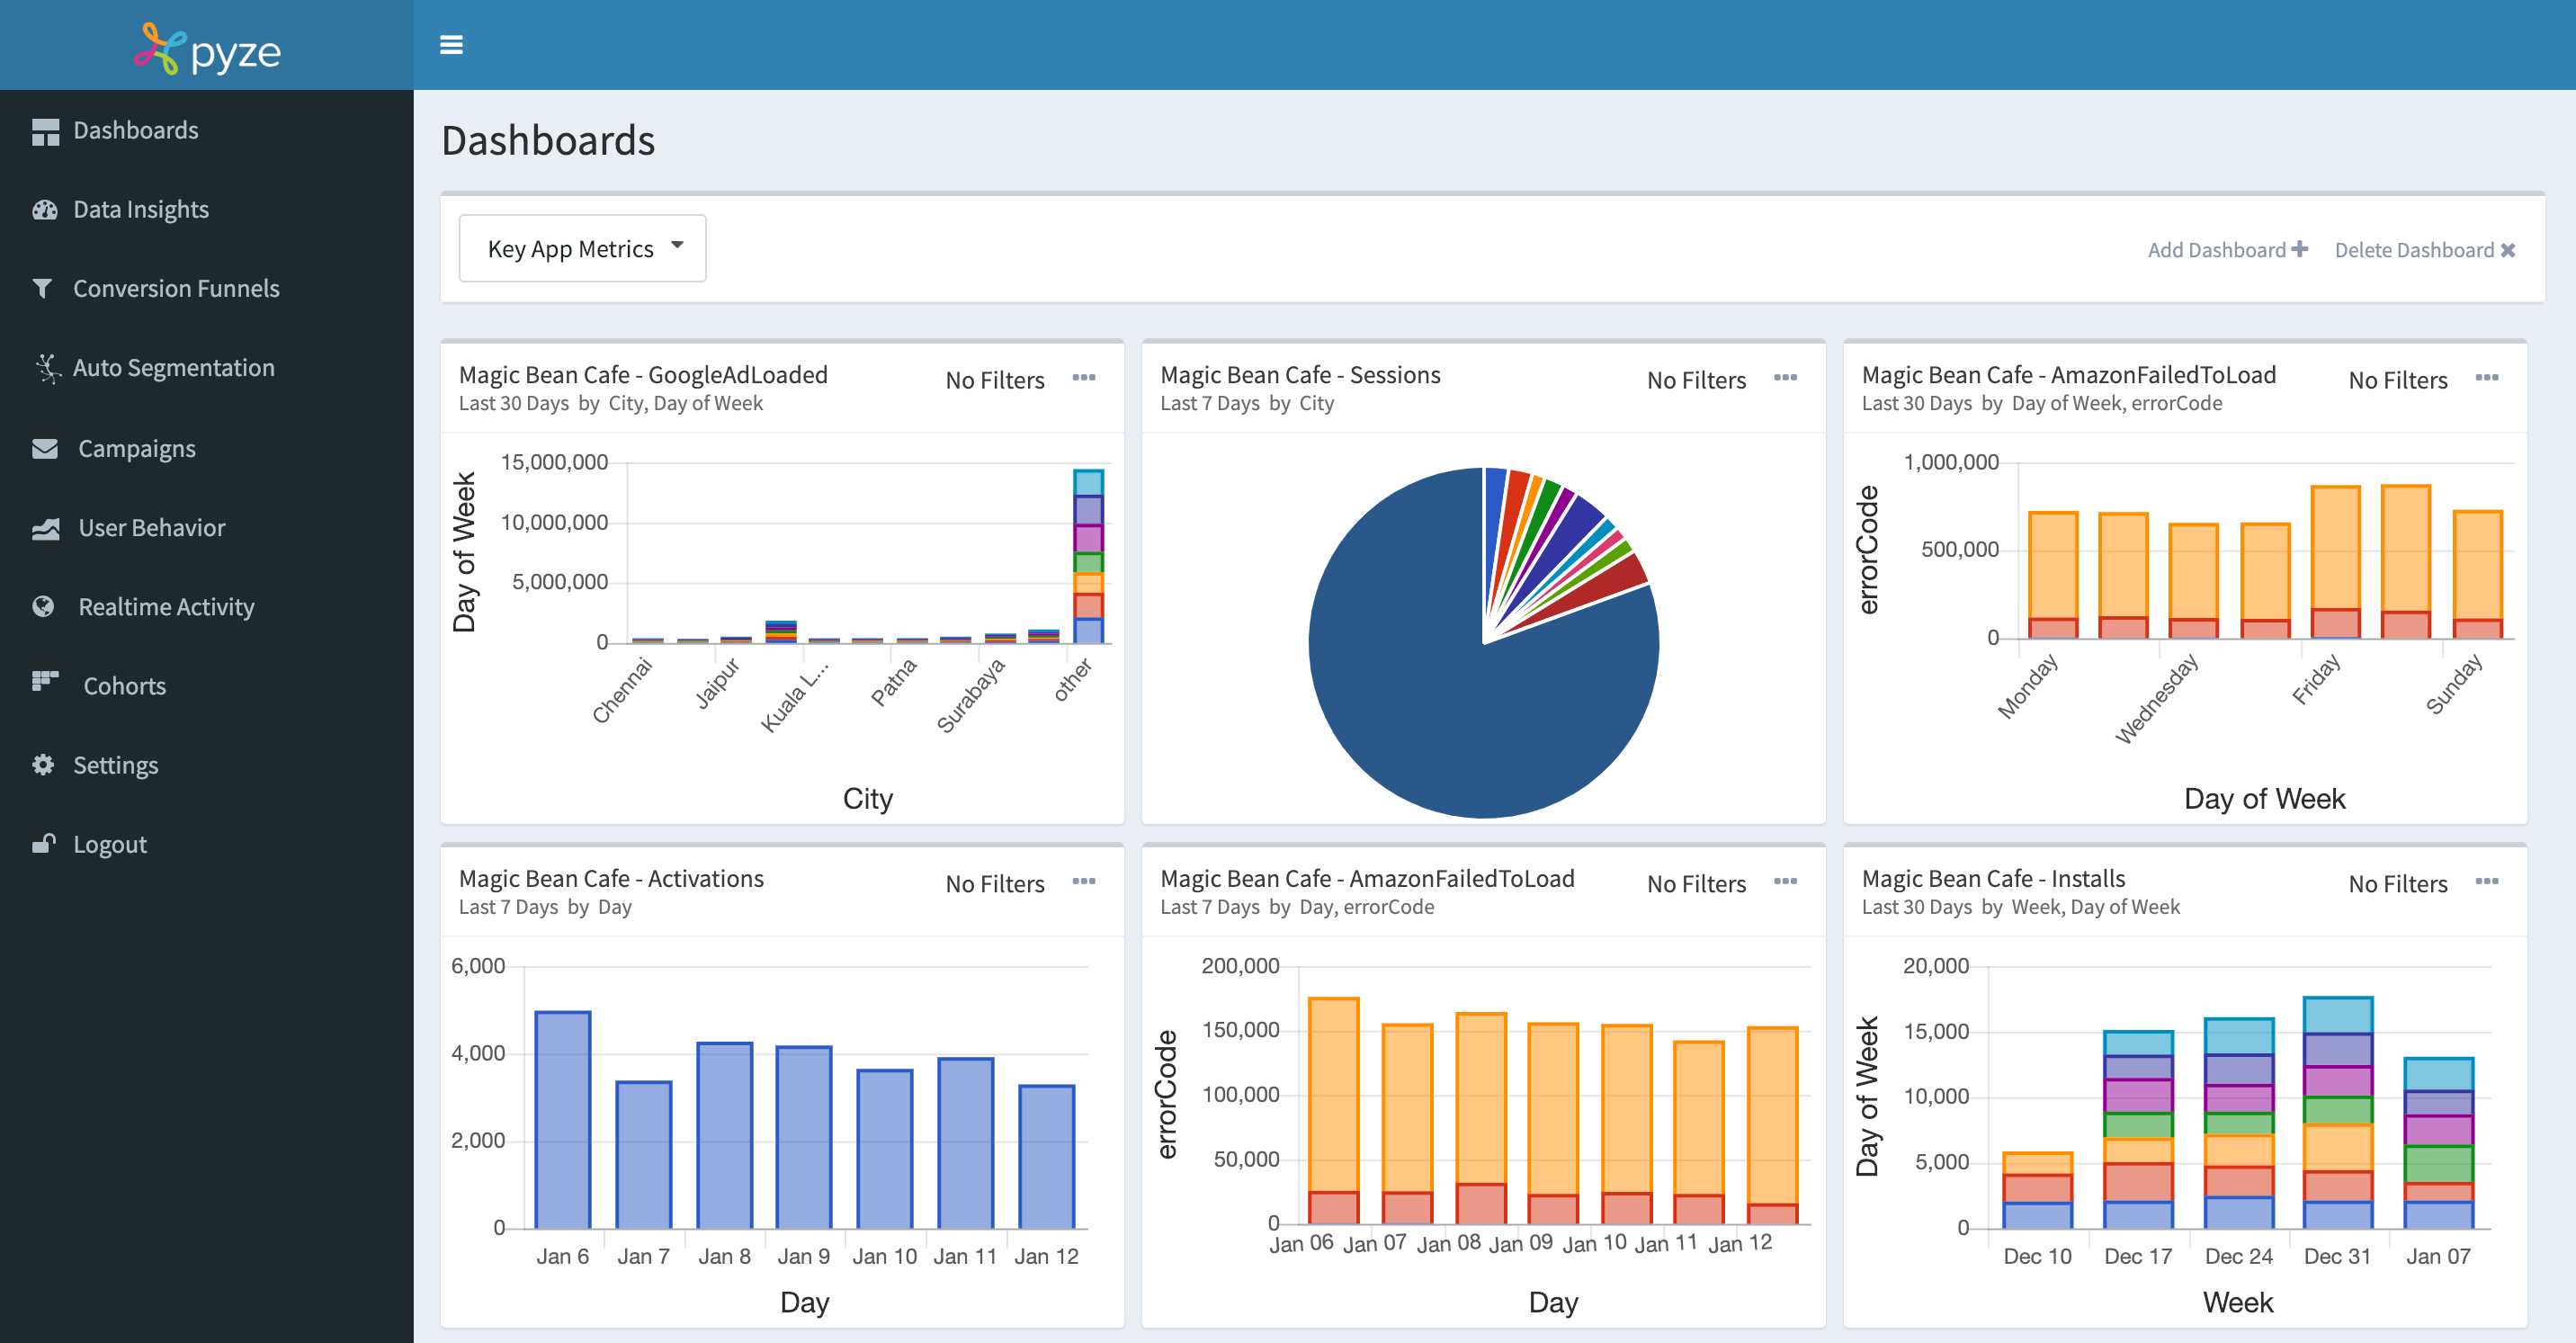
Dashboards are your window into the Key Performance Indicators of your app. Use dashboards to track changes over time, watch multiple indicators at once, and showcase metrics that are most important to you.
You can create an unlimited number of dashboards, and each team member in your account can create and manage them across the portfolio.
- Dashboards can be created and deleted by clicking on the Add Dashboard/Delete Dashboard buttons located at the top right of the window.
- Add charts to a new or existing dashboard from the Data Insights tool.
- Once visualizations are added to a Dashboard, they can be arranged simply by dragging and dropping into a specified location.
- All Dashboards can be accessed by clicking on the drop down menu located at the top left of the Dashboards window.
Tracking Key Metrics & KPIs
With Dashboards, you can easily keep track of key metrics and KPIs. Simply create and add the data set to your dashboard using Data Insights. This gives you an at-a-glance approach to viewing paramount data such as Installs, Sessions, Activations, etc. without having to build a data query each time you need this information.
Last modified 0001-01-01